Tutorials • Webuzo
Awstats Webuzo
AWStats Webuzo or Advanced Web Statistics (AWStats) provides us with statistics about the traffic to our site. It is available only on a Webuzo Premium license.
Views 787Updated 1 anPublished on 05/02/2020by Florin P.
Introduction
- In this tutorial, we will show you how to view statistics about the traffic to our site using Advanced Web Statistics (AWStats).
Requirements
- Access to the Webuzo control panel.
Steps
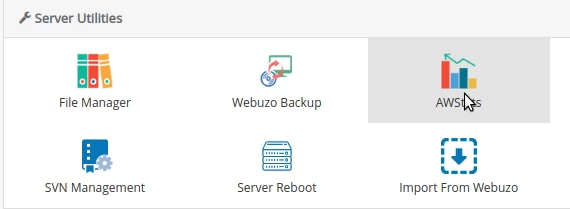
- After logging in to the panel, we will go to Server utilities, click on Awstats.
- A new page will open, and the Awstats interface will display the traffic statistics for our domain.

At the beginning of the AWStats page, it displays a summary of the most important information.
- Reported period - from the drop-down menu we select the period for which we want to display the information.
- First and Last Visit to the Website - first and last visit to the website.
- Orange - the number of unique users.
- Yellow - the total number of visits to the website, as well as the average number of visits per unique visitor.
- Blue - the number of pages loaded for visits, as well as how many pages per visit on average.
- Cyan - the number of results (page requests), as well as the number of clicks per visit on average.
- Green - the total bandwidth used, as well as how much bandwidth was used per visit on average.

Monthly history.
- The monthly history will detail the sections below for each month of the calendar year. This allows you to track major trends throughout the current calendar year, enabling you to be aware of any major changes in visitor traffic, whether due to major updates or significant additions or reductions in content on your site.
- Orange - the number of unique visitors per month.
- Yellow - the total number of visits per month.
- Blue - the total number of pages per month.
- Cyan - the total number of page requests per month.
- Green - the total bandwidth used per month.

History of the days of the month.
- The historical days of the month indicate the traffic recorded on the selected days of the month at the top of the summary page. This allows you to track daily trends by seeing the visitor traffic for each day of the reported month.
- Yellow - the number of visits.
- Blue - the number of pages.
- Cyan - the number of page requests.
- Green - the bandwidth used.

History of the days of the week.
- The history for the days of the week shows the total traffic accumulated on certain days of the week. This can be useful for determining peak hours for visitors, which can influence when you need to upload new content or perform any maintenance that may cause site interruptions.
- Blue - the number of pages.
- Cyan - the number of page requests.
- Green - the bandwidth used.

Hourly history.
- The history of hours shows us the total number of pages, requests, and bandwidth used at certain hours of the day.
- Blue - the number of pages.
- Cyan - the number of page requests.
- Green - the bandwidth used.

Locales

- Locales shows the top 25 locations from which visitors to the site originated during the reported month. This can help you determine where the largest audience is and whether you need to adapt your site's content or advertisements.
- Blue - the number of pages.
- Cyan - the number of page requests.
- Green - the bandwidth used.
Hosts

- The history will detail the top 25 unique visitors to the site during the reported month. This table reports the unique visitors who visited the site, including the following records:
- Host IP - the IP address of the visitor.
- Blue - the number of pages.
- Cyan - the number of page requests.
- Green - the bandwidth used.
- Timestamp - the time when the visitor last visited the site
Robots/Spiders

- This section details all the bots, spiders, and crawlers that have accessed the site. Bots, also known as spiders or crawlers, are programs used by search engines to explore the web, collect, and download all the web content available on the sites they encounter.
Visits duration
- Displays the duration of visits on the site:

Viewed Pages
- The Pages-URL table shows you the top 25 viewed pages on the site
- URL of the web page
- How many times the page has been viewed
- The average response size for requests on the page
- How many times the page has been used as a landing page
- How many times the page has been used as an exit page
- A chart detailing the displayed data, average size, input and output in comparison

We are also provided information about the operating system of visitors, the type of browser used. For detailed information about the AWStats interface, you can access AWStats.